FxCop is a static analysis tool from Microsoft that checks software source code for conformance to the Microsoft .NET framework’s design guidelines. Static analysis is performed on either the source code files that define the software program or on the compiled software files. It is analysis that is performed before the program is run. This contrasts to dynamic analysis tools which act while the program is running. Both have their place in working towards improving software quality.
The name FxCop is derived from “Framework Cop”, so it represents a tool that polices a programmer’s software development so that it meets the .NET framework’s design guidelines. Fortunately the FxCop rule set is configurable so that a software developer can change the static analysis rules to match their internal policies. This is in fact what we are doing with FxCop within our software development processes.
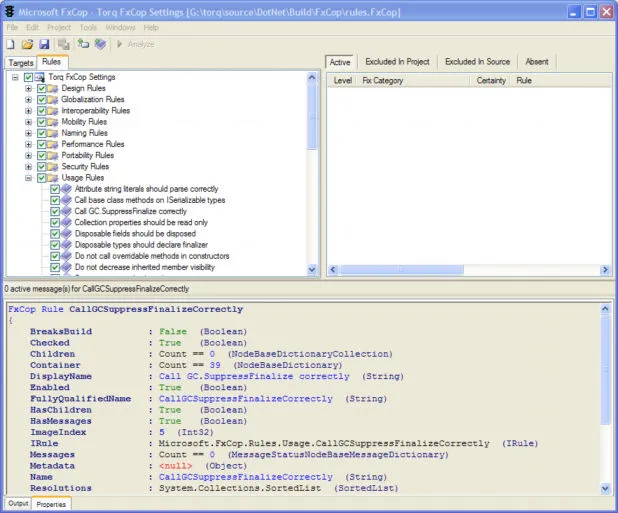
FxCop performs checks on .NET assemblies (dll or exe files) and doesn’t work on the source code directly. There are commercial static analysis tools available including those in Visual Studio Team System and other third parties such as NDepend and CodeIt.Right. As we use Visual Studio Professional and FxCop is appropriate for our needs, we’re going the free static analysis tool route. The goal is to increase code quality and in particular highlight obscure and difficult to remember design rules during the development process.
At the time of writing FxCop isn’t as integrated into Visual Studio as the commercial offerings. Regardless, with some adjustments to our development environment and processes it has been neatly integrated. The approach taken is to add another configuration type to our Visual Studio projects in addition to the defaults of Release and Debug. The additional configuration type has been called Analyse and is intended to be used for any static analysis functionality we choose to add in the future and as such is not limited to FxCop.
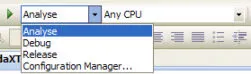
The Analyse configuration can be added to a solution in Visual Studio by displaying the Configuration Manager using the “Build-Configuration Manager” menu. Once the Configuration Manager form is displayed, choose the New option in the “Active Solution Configuration” drop down. Once the configuration has been added to the solution, a few more steps are needed as we’re using the Analyse configuration in the same way as the Debug configuration but with additional static analysis actions after every build action.
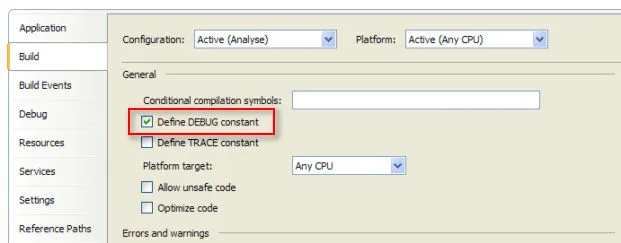
To make the Analyse configuration operate in a similar fashion to the Debug configuration we do the following for each project that needs static analysis support:
- Set the “Defined DEBUG constant” checkbox in the Build tab for the project.
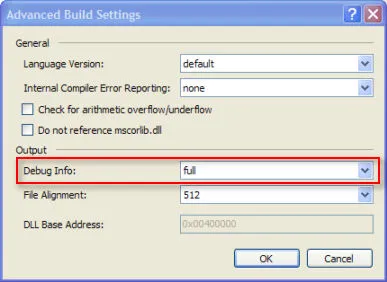
- Set the Debug Info setting to “Full” in the Advanced Build settings form that is also available from the Build tab for the project.
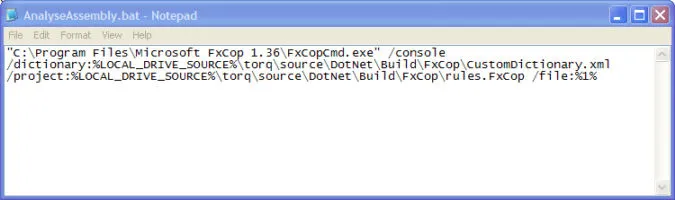
- Add a call to the AnalyseAssembly batch file to the post build step of the project. A batch file is used to keep the post build step code short and allows us to modify the analysis actions in one location within our development build environment. This then requires the batch file directory to be in the executable path of the development machine.

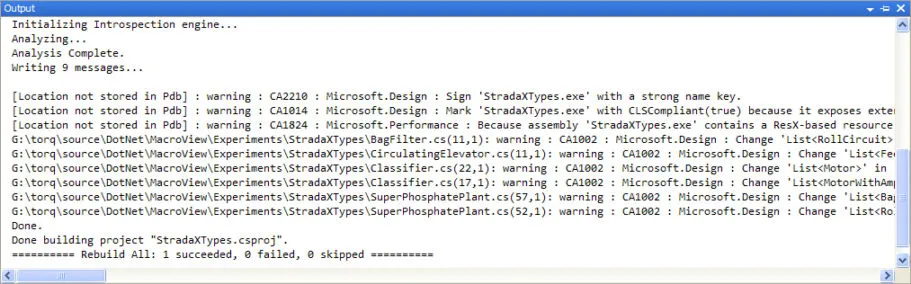
The AnalyseAssembly batch file is fairly simple, it just runs the command line version of FxCop with the custom dictionary and rule set that we’ve configured.
With the Analysis configuration in place, a developer can easily flip to the Analyse configuration option in Visual Studio and compile to see the static analysis results. In addition, the continuous integration system can include the analysis steps in the automated build process. We’ve just recently started using FxCop and are in the process of updating our Visual Studio projects to use the approach documented here. An involved part of this process is choosing which FxCop rules to use and which ones to disable as some of them are certainly too restrictive for our needs.